Episode 39
Current Australian Share Market
Welcome to Finance and Fury
Shares are at almost the same price as 2 years ago in Australia – What is happening?
- Mid Dec 2016 – 5,580 and last week the 3rd of December – 5,667
- Today – is it a great time to buy some shares or a warning sign of things to come?
- Break down the health of the market, some reasons for the decline, and what the future may have in store
To start – clarify some things
- When talking about shares there are monoliths of the market – ASX 300, but there are:
- Financials make up a large chunk (35% approx.) – These have been declining
- XXJ and XFJ = -11% over that time period = -3.6% decline in ASX
- Telecommunications (TLS) – Much smaller percentage of the market
- XTJ = -37% over that time period
- Volatility – Shows the average movements in price from their average over a period of time
- Higher levels of volatility can show that markets will rebound
- Volatility is higher when markets have declined – Markets go down faster than they go up
- Higher levels of volatility can show that markets will rebound
- Financials make up a large chunk (35% approx.) – These have been declining
Good time to buy?
- Looking back through history there are indicators, attached are graphs to help communicate this.
- Since 1900 the average return of 13.21% p.a., this is a very long-term average and includes dividends (the accumulation index).
- 22 (19%) negative years: 12 years (-10-0%), 6 years (-20-10%), 3 years (-30-20%), 1 year (-40%) – GFC
- 96 (81%) positive years: 19 years (0-10%), 48 years (10-20%), 17 years (20-30%), 3 years (30-40%), 7 years (40-50%), 1 year (50-60%), 2 years (60+)
- Past 12 months: -5.1% – Pretty small decline, so is the market likely to have another negative year?
- Back to back negative returns have happened 5 times throughout the last 118 years, detailed below:
- 1915-1916: -1.9% and -1.7% (-3.6% cumulative) – Gain of 427% before (13 positive years)
- 1929-1930: -3.6% and -28.1% (-30.7% cumulative) – Gain of 517% before (12 positive years)
- 1951-1952: -3.3% and -11.8% (-14.7% cumulative) – Gain of 285% before (9 positive years)
- 1973-1974: -23.3% and -26.9% (-44% cumulative) – Gain of 441% before (10 positive, 2 negative years)
- 1981-1982: -12.9% and -13.9% (-25% cumulative) – Gain of 584% before (6 positive years)
- From 2009 to 2017 – 246% gain, including this year back down to 234%
- From 2012 to 2017 – 193% gain, (-11.4% in 2011) – Historically speaking we shouldn’t get a negative return 2 years in a row based around the trigger in gains.
What is the health of the market?
- Fundamentals – GDP
- GDP growth is low – 2.8% this the last measurement
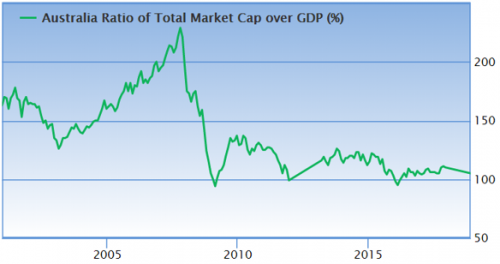
- 100% to GDP – Back to 2008 levels
- Our economy isn’t going so well comparatively, this is not a good sign
- High Corp tax rates and low productivity, this is a sign of poor performance
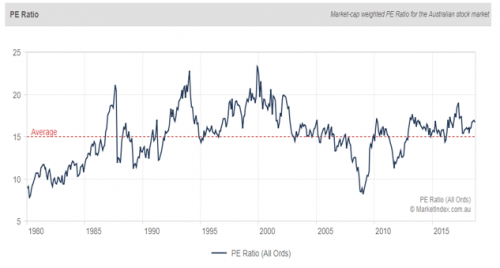
- P/E – Market price today of 5720. This leaves a PE of 15.04 which is the long-term average
- Indicates that the markets are fairly priced
- PE drops around – 2 metrics P & E
- Market crashes – Prices go down
- Earnings reductions, we haven’t had reductions on a massive scale. Currently a bit below long-term average.
- Dividend yields are currently sitting at 4.8%, this is fairly stable
- Back below longer-term averages of 4.4%
- Shares are technically cheap based on income yields
Why is it declining then?
- Worries and lack of confidence
- Political uncertainty, we have an election coming soon
- Media stories – constant news cycles
- The issues will be confidence in the market
- World economy – We follow America in shocks
- Sadly not on the way up over the past 2 years. We haven’t had the increase, so will we see a decrease?
- Trump, gives the market confidence as he lowers taxes, cuts regulations and makes it easier for business
- Riots (more protests) – The yellow vests, thousands of protesters all through France, Brussels, and the Netherlands
Where it might be heading
- Prices – While fundamentals look okay, the market isn’t rational
- Emotions and fear – They can be rational (running from the guy with the knife), but loss aversion leads to irrational behaviour in the market
- Currently – 9 periods EMA is below the 21 periods EMA, then you likely see the market go down further
- Shares not quite oversold either
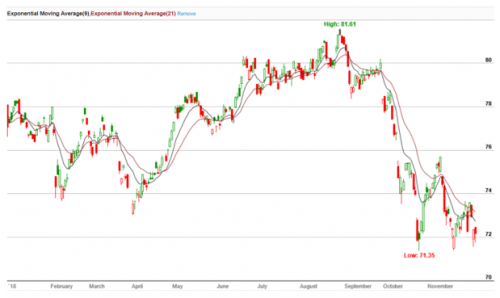
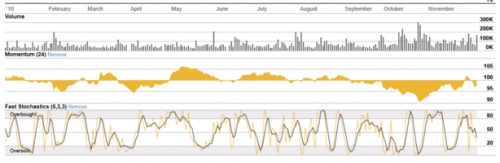
- The market looks to be bottoming out soon – But doesn’t seem to be there just yet
- However – Still a good time to buy for the long-term (10+ years), break it up over time.
- Self-fulfilling prophecy – not the only one who can look at a chart to see this
- Massive market crash predicted – Mathematicians claim unprecedented global disaster coming soon
- Using analysis
- More likely to happen that they are saying this
- But the timeframes are 10+ years so who knows
Summary
- Nobody can time the market or know when a crash will occur
- Financials have dropped in prices a lot, from the royal commission and payouts
- Seem to be undervalued but updates may prove they will lose a lot of future profits
- Earnings have been declining
- Seem to be undervalued but updates may prove they will lose a lot of future profits
- General advice: Get active funds that work outside of top 20 – These show better long-term returns
- Mid-cap funds have average annualised returns of about 13-17% over 10 years, ASX (inc div) – 8%
References:
Australia Stock Market Valuations and Expected Future Returns
https://www.gurufocus.com/global-market-valuation.php?country=AUS
Mathematicians claim ‘unprecedented’ global disaster is just years away
Australian Sharemarket – 118 Years of Historical Returns
The Australian Economy and Financial Markets
https://www.rba.gov.au/chart-pack/pdf/chart-pack.pdf?v=2018-12-05-14-09-41